
As a business, you are interested in measuring the effectiveness of your social media efforts. Besides engaging your audience, hashtags, memes or viral content, social media KPIs show you exactly how social media contributes to your business development.
Reading this article will provide you with the needed knowledge to navigate the social media measurement intricacies with confidence. You will find out what social media KPIs are the most relevant, how to select the right ones and other practical insights.
What Are Social Media KPIs?
Social media KPIs are metrics that help you assess the performance of your social media marketing activity. And reliable instruments that allow you to track, measure and evaluate your progress toward your social media strategic goals.
The power of these KPIs relies on their capacity to provide data-backed insights and reliable ways to improve your social media performance.
Here are some essential home truths about KPIs for social media:
- Tracking social media isn’t just a matter for your marketing department.
- Not all social media metrics are equally helpful and valuable to your business.
- Many businesses focus on the wrong ones.
There is plenty of value to be found in customer-created content on social media. But with endless social listening tools out there capable of measuring countless different metrics, it can be difficult to discern which social media KPIs are worth tracking and which are, frankly, a waste of time.
Distinguish between actionable KPIs and Vanity Metrics
This is a critical aspect, as some vanity metrics like the number of followers or the number of likes lack effectiveness and don’t have a tangible impact on your business.
Your purpose should be to track the actionable KPIs. Those that directly impact the evolution of your business goals and offer insights for improvement. In the end, they translate into significant actions and outcomes.
Typically, marketers focus on impressions, likes, shares and retweets. These metrics are easy to track and tabulate.
They’re a decent measure of engagement and the success of your marketing campaign, but they do little else to inform you about the evolution of your business.
For example, these metrics don’t tell you anything about consumer behaviour or about the customer’s experiences with your brand or product. Although they can be helpful, vanity metrics don’t make the cut.
Social Media KPIs Types
- Reach and awareness social media KPIs. Are in charge of measuring how many persons have seen your social content and expressing your brand’s reach via impressions.
- Engagement social media KPIs. They reveal the capacity of your content to connect with your target audience. Such social media KPIs examples are likes, shares, comments and click-through rates. A high engagement contributes significantly to increased visibility and brand loyalty.
- Conversion metrics. In a word, this type of KPIs tracks the user journey from a social media interaction to a meaningful action for the business, like a sale or subscription to a mailing list. They help you gauge the contribution of social media to business results. Some examples are conversion rate, cost per conversion, and click-through rate.
- Customer satisfaction KPIs. Metrics like reviews, customer feedback, customer sentiment analysis and Net Promoter Score provide valuable insights related to your customer satisfaction and how your target audience perceives your brand.
Set SMART KPIs
SMART (specific, measurable, achievable, relevant, timely) KPIs are the backbone of a successful social media strategy. Their role is to keep you focused on clear, realistic goals and accountable.
An example of a SMART goal is “Increase TikTok engagement by 30% within the next year”.
What Are the Key Performance Indicators of Social Media?
Engagement KPIs
These metrics show the level of connection, interest and interaction that your social content generates among social users.
Examples of social media KPIs for engagement:
Likes
They reveal appreciation and mean that your content resonates with your audience. More likes suggest that the content touched a chord, and similar content creation is a good option in the future.
Comments
Taking the time to leave a comment and getting involved in the conversation with your brand is a high signal of interest. Comments are a type of interaction with significant potential as they deliver feedback and insights and tighten the connection with your target audience.
Shares
Shares are one of the main pillars of brand awareness. When a user shares your content with his social network, your reach extends. They are more than an endorsement, they are a vote for your content quality and an essential element for social virality.
Click-Through Rate (CTR)
CTR is the percentage of people who take action when viewing your social content. It might be a click on a button, on a link, on a video, on an image or other interactive part of your post.
The higher the CTR, the better. It proves that your content is efficient and reaches its goals of encouraging actions like buying, signing up or finding out more details about your products/services and activity.
Follower Growth Rate
If the number of followers is more of a vanity metric, the follower growth rate embeds more significance. It measures how fast your social following is expanding.
A follower growth rate that has a steady ascendent path translates most often into increasing brand exposure and improved engagement.
What drives your customers to choose you over your competitors? What pain points threaten their customer loyalty? Your customers are out there sharing their experiences of your brand and your products in comments, posts, and reviews on social media.
However, this non-numerical data is often overlooked. Without the right technology, long-form text is complex (if not impossible) to accurately capture, measure and analyse on a large scale.
Rudimentary social listening tools simply use word clouds to show which words occur most frequently in online conversations, but now there are far more advanced ways of analysing unstructured text data.
Symanto’s cutting-edge natural language processing (NLP) technology accurately identifies topics and organises information so that you can get detailed insights into what your customers are talking about.
This technology recognises synonyms and nuances in speech, can group topics together and then divide them by subtopics.
Next, the information is organised into interactive data visualisations that enable you to navigate the information and explore it at the level of detail that you require.
Subsequently, this analysis is combined with segmentation and sentiment analysis to obtain highly qualitative insights at scale. Symanto’s topic analysis’s primary purpose is to spot the loyalty triggers, the drivers of loyalty and the barriers.
It uses industry models created based on millions of texts in order to depict the exact meaning of specific expressions of a particular topic. Moreover, domain experts manually verify the topic structure of each model to obtain the highest relevancy.
As a consequence, our clients receive top-level topic analysis and have the possibility to adapt the model further if needed.
Conversion Metrics
Conversion KPIs measure the effectiveness of your social strategy and its tangible financial results for the business.
Let’s check some vital conversion metrics:
Conversion Rate
The conversion rate shows the capacity of your content to convince the target audience to take the desired action. By action, we understand an act like downloading a lead magnet, making a purchase, signing up for a newsletter, filling out a form, etc.
Practically, the conversion rate provides an answer to the following question: “How many persons of those who saw our content acted as we wanted them to?”.
Businesses are interested in maximising their conversion rates. As they prove the quality of the produced content, the effectiveness of their call to action and that of their landing page. It’s more than attracting the right audience is about convincing her to take the desired action.
Cost per Conversion and Cost per Acquisition (CPA)
These are significant metrics as they reveal the efficiency of your social media campaigns from different angles.
Cost per conversion refers to the cost to get a lead, while the cost per acquisition refers to the cost to get a customer. They both quantify the financial viability of your social media efforts.
The cost per acquisition is a usual metric to measure the effectiveness of social media advertising campaigns.
Brands are always looking to lower their costs per conversion and per acquisition in order to allocate better their available budgets and maximise their return on investment.
Revenue Attribution
This social media KPI reveals how much revenue you generate via social media efforts. In practice, it means reviewing the journey from the first social media interaction to a conversion or sale and assigning financial value to the respective touchpoint.
Revenue attribution highlights the economic impact of social media activities on the business’s turnover. It’s valuable as it helps gauge the effectiveness of social media campaigns and channels and offers insights on how to allocate budgets for the best results.
Reach and Awareness Social Media KPIs
In terms of brand influence, these metrics offer details concerning your brand’s visibility on social media and the degree of resonance with the target consumers.
Keep on the radar KPIs like:
Impressions
They are an expression of your brand’s exposure and reflect the number of potential eyeballs on your social content. Or how many times your content is listed on your audience’s social feed.
A high level of impressions means your posts show up frequently in your target audience’s feed, even if they don’t necessarily interact with your content.
Post Reach
It is a specific post metric, indicating the number of unique accounts that see your posts in their feed. In a word, it’s about the number of individual persons who view your posts.
Reach and impressions combined offer insights regarding your content exposure. High levels for these metrics indicate that your content is resonating with your target consumers and has virality potential.
Share of voice
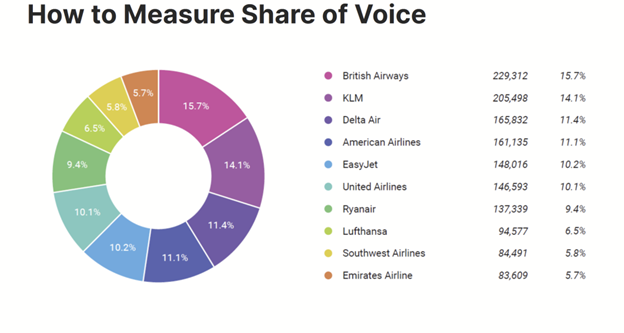
Source: SEJ
Traditionally, share of voice was measured by comparing your media spending with your competitors. But increasingly, it refers to your brand’s visibility online compared to your competition.
Share of voice is measured as a percentage. The more mentions your brand receives in comparison to other brands in your industry, the higher your share of voice.
Share of voice gives you a straightforward and clear overview of the landscape of your market. By tracking the share of voice over time, you can spot whether any of your competitors are gaining traction and investigate further to take appropriate action before they dominate the market.
By tracking the Share of Voice, you can have a detailed grasp of your brand’s position and derive insights to enhance your influence and presence on social media.
Since social media share of voice is measured using publicly available data, it’s a non-intrusive form of competitor intelligence.
Customer Satisfaction Metrics
For any business, keeping an eye on customer satisfaction is paramount. In the case of social media, it’s not just about capturing attention, it’s about building strong relationships and making your audience feel valued.
The most relevant customer satisfaction social media KPIs are:
Net Promoter Score (NPS)
This is a powerful performance indicator that delves into customer satisfaction and loyalty. Practically, it measures if your customers are likely to recommend your products/services or brand to other people.
NPS is generated by asking your current customer a question similar to this one “ How likely are you to recommend our brand/product to a friend on a scale of 0 to 10?”
Net Promoter Score groups customers on the following categories:
- Promoters (their score is between 9 and 10) – these are persons who promote your brand and offer; in a word, they are your brand advocates.
- Passives (their score is between 9 and 10) – satisfied customers but not willing to recommend your brand.
- Detractors (their score is between 0 and 6) – clients who are not entirely satisfied and are more likely to share negative feedback.
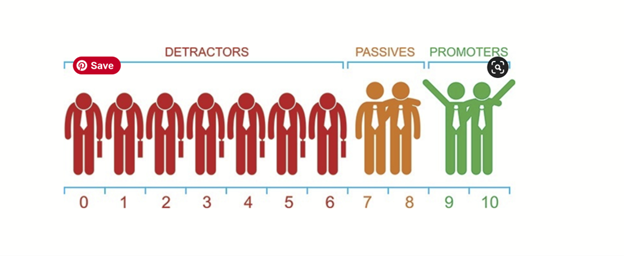
Source: PeoplePulse
To calculate NPS for your business, subtract the percentage of detractors from the percentage of promoters.
A high level of NPS is proof of customer satisfaction which usually translates into word-of-mouth activities and brand expansion.
Customer Feedback and Sentiment Analysis
Increasingly, your reputation is defined by what people say about you. About half of consumers distrust paid media, while a whopping 92% say they trust earned media.
Earned media is any exposure or publicity that isn’t gained through paid marketing and advertising, and that includes organic social media content.
Your customer’s opinions matter more than ever.
Getting an accurate measure of their sentiment is a crucial first step in determining how you should develop your product and market your brand.
Social media metrics aren’t just a measure of your marketing and PR campaigns. This metric in particular, gives you clear insights into the strengths and weaknesses of your product from the perspective of the people that matter most: your customers.
Customer satisfaction metrics deal with emotions and relationships.
Customer Feedback
Customer feedback is an invaluable source of insights that reveals what your target audience feels and thinks about your products and brand. To gather feedback, you can use multiple sources like surveys, forms, comments, reviews, and social media messages.
To have a proper measurement of customer satisfaction, you have to analyse this feedback carefully and also the sentiment behind it.
Sentiment Analysis
Sentiment analysis consists of using advanced technology like AI to depict the emotions and tone behind customer feedback and social media messages. It classifies the sentiment into the following categories positive, negative and neutral.
This analysis provides insights, uncovers patterns and trends and offers a data-backed basis for strategic decisions that address pain points and marketing strategies.
Symanto measures sentiment by topic and subtopic so that you can get a precise understanding of what aspects of your product need development and which are driving your product success amongst your existing consumer base.
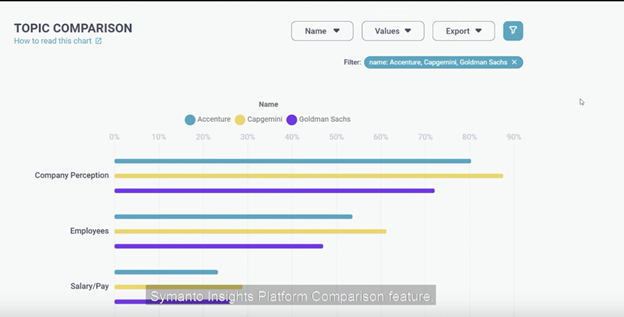
Furthermore, Symanto makes benchmarking easy. Compare conversations across multiple brands to find out how your performance compares. Are your competitors facing similar challenges? Is one of your competitors meeting the needs of your customers better, and if so, how?
The interactive nature of the Symanto dashboard allows you to zoom in on relevant conversations to see exactly what customers are saying.
Symanto technology makes it easy to measure and compare these social media KPIs and get other exciting insights from social media data, such as consumer psychographics. For more information, get in touch or book your free personalised demonstration today.
How to Select the Right Social Media KPIs?
To ensure the success of your social media activity, you have to pick the correct key performance indicators for your business.
When making the selection, consider the following:
- Your business goals. Decide what you want to accomplish via social media activity. It could be expand brand awareness, increase sales, foster customer loyalty, etc. Choose the social KPIs in line with these goals and calibrate your social media strategy with your marketing and business strategies.
- Customer journey. Your KPIs should be aligned with the stages of the customer journey awareness, consideration, conversion, and retention. For example, for the awareness stage, you could choose reach and impressions as performance indicators. In the retention stage, NPS and sentiment analysis.
- Requirements of the social media platform. Each social channel has its particularities, its audience demographics and user behaviour. Consequently, KPIs should consider this. For example, on Instagram, you could focus on eye-catching visuals and track likes, shares and comments. On LinkedIn, lead generation might be a priority.
- Your industry. There might be specificities and challenges that are characteristic of your industry. Check relevant case studies from your domain and see how leaders approach situations similar to yours.
The above-mentioned social media KPIs serve as building blocks for measuring your social media success. Be strategic and choose the ones that fit your business and goals. Monitor and analyse them regularly and fine-tune your social media strategies accordingly to drive better results.
