
The Symanto Insights Platform is extremely versatile and can be applied to many use cases. If you want to get the most out of the platform, you must first define a specific objective before exploring the data. What is it you’re looking for?
In this blog, we’ll explore how you can use the Symanto Insights Platform for measuring brand equity. We’ll be using the example of three popular streaming services: Netflix, Disney+ and Prime Video.
Discover how easy it is to upload and analyse data and extract insights from our intuitive data visualisation.
What is Brand Equity?
Brand equity is the value premium that recognisability and brand sentiment add to a company’s revenue. Businesses earn brand equity by consistently providing superior quality, more reliable products or services, or by making the brand more memorable and easy to recognise.
Measuring Brand Equity with the Symanto Insights Platform
Measuring brand equity is a challenge because there is no single set of metrics that can give us a solid answer. Therefore the best way to measure brand equity is to look at various indicators such as:
- Brand awareness – Is your target audience aware of you, or even better, are you their first port of call when seeking out the type of product or service you offer? What’s your share of the online conversation when compared with your competitors?
- Brand sentiment – Do your customers have an emotional connection to your brand?
- Brand recommendations – What’s the likelihood that your customers would recommend your brand to their friends and family?
The Symanto Insights Platform can quickly and easily analyse existing data online to provide insights into these indicators. We’ll show you just how simple the process is.
Get Started with Data Collection
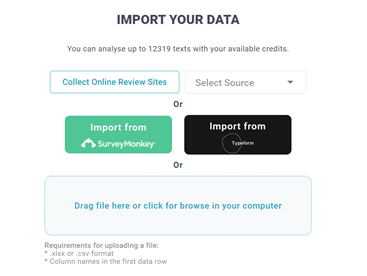
1. Upload your data
First thing’s first. You need data. Luckily the Symanto Insights Platform is connected to over 75 review sites with plenty of existing data in the form of reviews and comments.
You can also use the Symanto Insights Platform to pull data from online surveys conducted through SurveyMonkey or TypeForm.
Alternatively, upload an excel or CSV file with comments you’ve collected via other means, for example reviews collected from the App / Google Play Store.
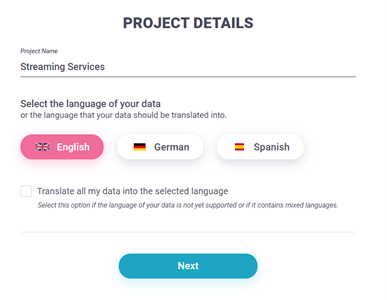
2. Name your project
Next you’ll be prompted to give your project a name and select the language you’d like to receive your results in.
3. Select a use case:
Then you’ll be asked to select from one of our existing use cases. These function as dictionaries for a more accurate analysis. For example, the word “stall” in car dealership is very negative, whereas the same word in retail has a very different meaning.
Existing use cases include: banking, car dealership, consumer electronics, eCommerce, employee satisfaction, hotel, pharma, restaurant, and retail. If you can’t find an appropriate category, you can select the generic use case.
4. Select a metafield with text
Finally, if you have chosen to upload your own excel or CSV file, you’ll be prompted to select a metafield to study in more depth. All other fields will also be included in the analysis, but we want to focus on the field with text.
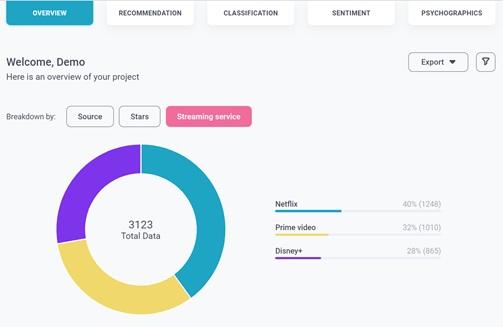
Overview
In this section you’ll see how much share of voice of your brand. In this instance we can see that Netflix has the larges share of comments (40%). You can also click on either stars or sources to see the split there too.
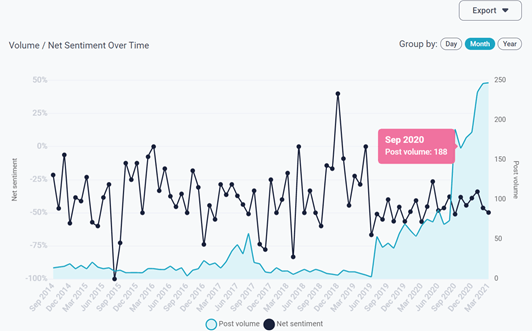
Scroll below to find Net Sentiment over time through the volume of comments. Net Sentiment is the net value of all those opinions expressed on social media about the brand, its products or its service. Here we can see it was at its height at the end of 2018 and then decreased dramatically by mid 2019, from which point it has been struggling to recover.
Recommendations
In our next tab we have “recommendations”. This tab shows us the likelihood that the authors of these comments would promote the streaming service, or whether they are detractors. This analysis shows that in all three cases, the majority of people would not recommend the streaming service. Netflix is the most negative, with a score of -39%, while Prime Video has the best score overall.
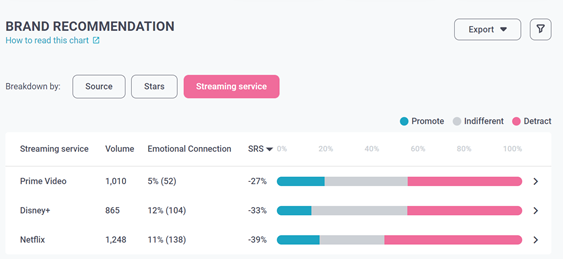
The Symanto Insights Platform enables us to delve deeper and explore exactly what’s going on here.
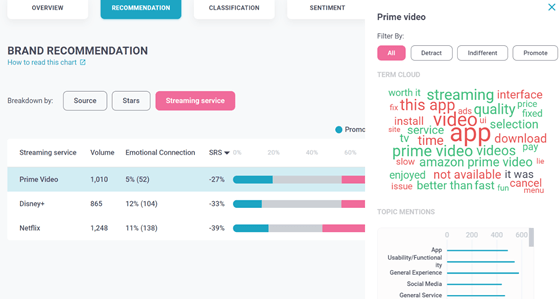
Prime Video
Within Prime Video, we can see that their app is not working right, service is slow, there are numerous issues popping up, it tends to be offline sometimes. Below you can see to what topics these terms relate to, such as the app in the first place, usability, gen. experience etc. You can also click on detract or promote or get a filtered view of the neg. or pos. comments.
Here we can see that the main issue with Prime video is that their app isn’t working. It seems it’s difficult to install, and that the service is sometimes unavailable. Below you can see to what topics these terms relate to, such as the app, usability, general experience, etc.
You can also click on the detract or promote tabs above the word cloud or get a filtered view of the positive and negative comments
Let’s compare this with the brand with the most negative recommendations score.
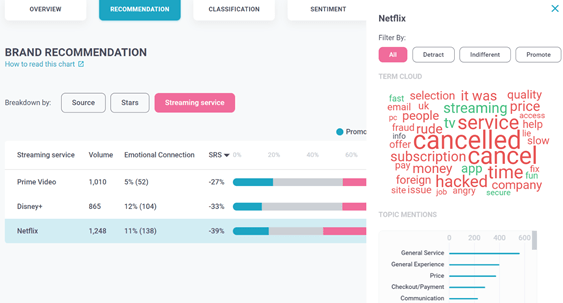
Netflix
Looking at Netflix, customers want to cancel it. That’s a serious issue. There’s talk about money, probably because Netflix hiked their prices around the time this research was conducted. Customer service tends to be rude and people have problems with access. As you can see, Netflix is experiencing vastly different problems compared to Prime Video.
Emotional Connection
It’s interesting, though perhaps not surprising to learn that Disney+ has the highest Emotional Connection score. Maybe we can speculate that many customers are reminded of their childhood, or connecting with their children when using this service.
We can see that different groups connect differently to each brand. Disney+ connects in an emotional way, while Prime Video users do not set an emotional tone, but rather a rational one.
Classification
The classification tab helps us answer two important questions with regards to measuring brand equity. 1) What are the most talked topics people talk about for a specific brand and 2) Are they loyal to their choice?
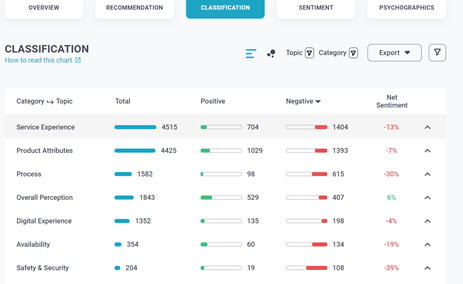
At first we see a general list of topics sorted out by the number of times they are mentioned. We can sort by the most positive or negative topics.
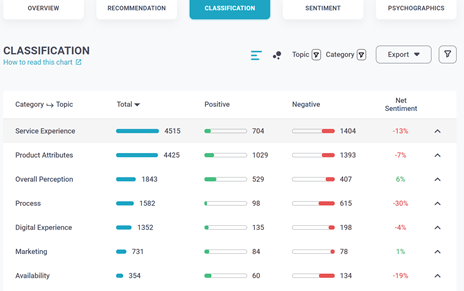
Here we see that product attributes is the most positive topic…
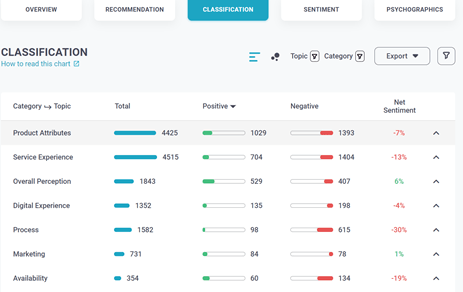
… and Service experience is the most negative.
You can also choose to get a more visual overview of the situation by clicking on the bubble icon to view the bubble chart.
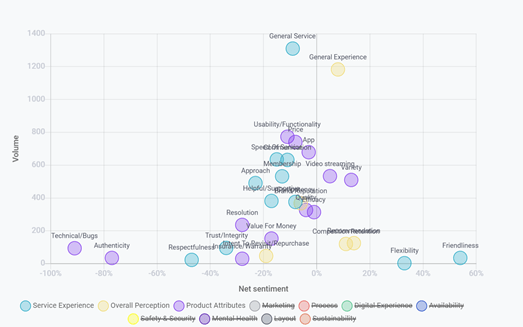
The topics with the most mentions float to the top, the positive ones move to the right and the negative ones move to the left.
Disney +
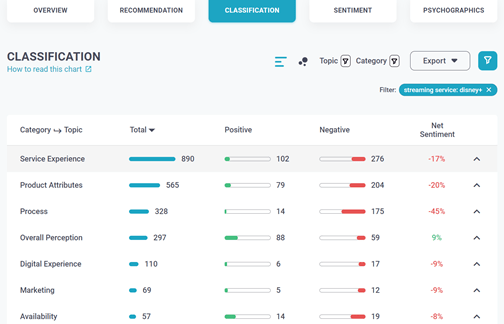
Let’s delve into Disney+. This service is middling when it comes to being recommended, so we can look at what is keeping balancing between the positive and negative comments and what would need to be improved to make it more recommendable.
As you can see here, service experience, product attributes and process (of subscribing / payment/checkout) are both the most positive and the most negative categories mentioned.
By clicking on each of these tabs we can see what they mostly refer to and figure out potential ways of improving them.
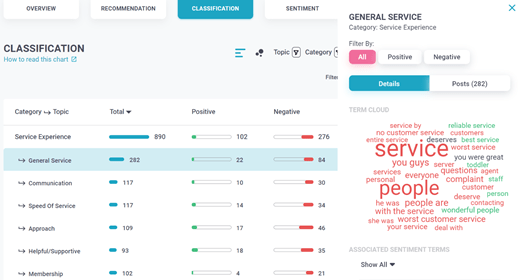
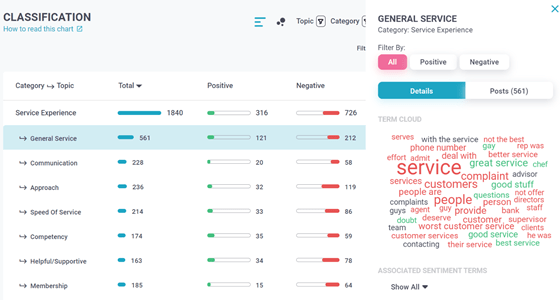
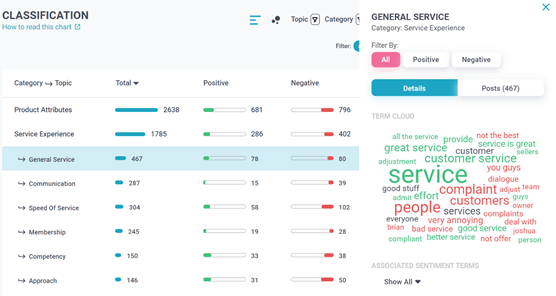
General service is a popular topic when it comes to service experience. We can see here that customer service needs some improvement as people are mentioning “worst service” and even “no customer service”. In some exceptional instances, customers described it as wonderful and best service. Could additional training and standardisation of services help?
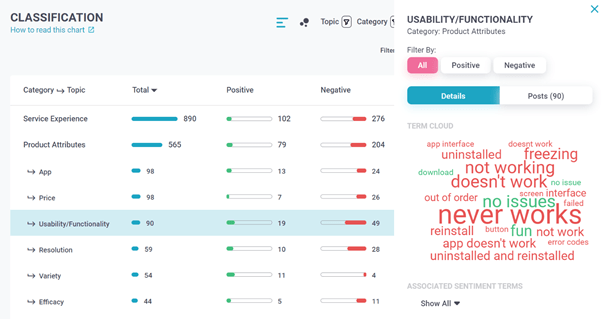
When talking about product attributes, people refer to the usability and functionality of the app. It seems that many times the service freezes or just simply doesn’t work. Multiple re-installing of the service doesn’t help either. So it seems like further app development is needed to achieve a better user experience.
When it comes to process, people mostly talk about order cancellation and checkout or payment. They are either unable or ready to cancel it or they’ve already cancelled it.
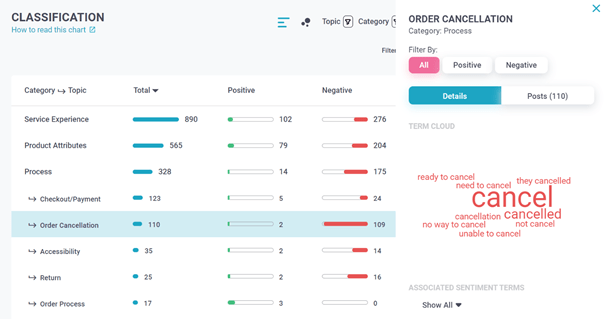
Why do customers talk so much about it and why did Disney+ already lose a fair amount of users? We need to know more. So it’s time to click on the post to delve even deeper.

As you can see “cancel culture” is the reason why the word “cancel” appears so many times, and it’s the reason why some people are cancelling their subscription.
Netflix
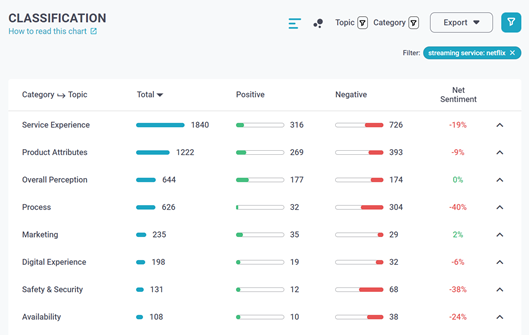
Service experience and product attributes are the two most-mentioned categories for Netflix too, while the third one is overall perception.
Diving in we can see that with regards to service experience, there is a great talk about complaints and low effort on the part of customer service to provide help.
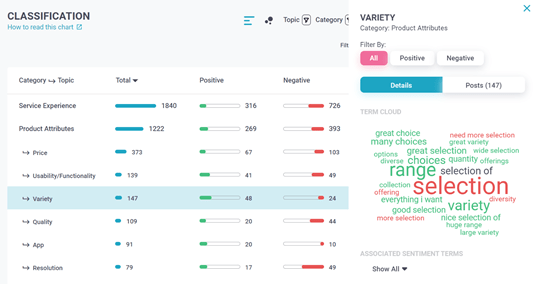
When it comes to product attributes, people mostly talk about the prices and variety of movies or series the most. There’s a lot of complaint about the price hike though some of the comments mention that this service provides good value and is still affordable.

With regards to variety, it shows that Netflix does provide a good amount of diversified content with a few requests to have an even bigger selection.
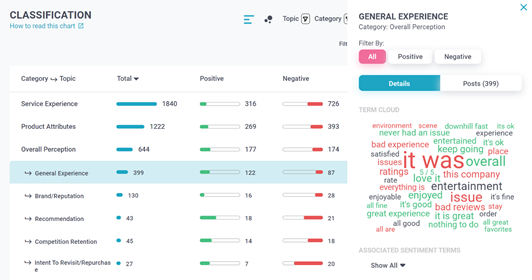
The last category refers to overall customer perception of the brand, recommendation and reputation, all of which play a big role in whether a customer decides to choose the service or not.
Prime Video

Unlike for the first two services product attributes is the most mentioned category for Prime Video.
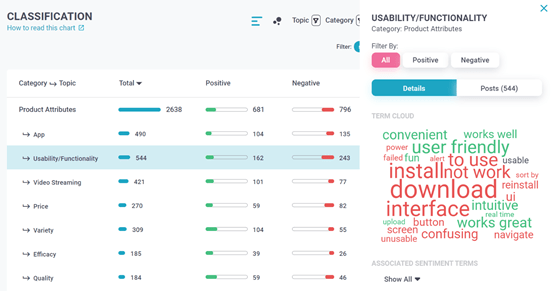
The overall usability and especially the app doesn’t seem as intuitive and friendly as it ought to be. The interface doesn’t work, and it seems to be quite confusing to navigate.

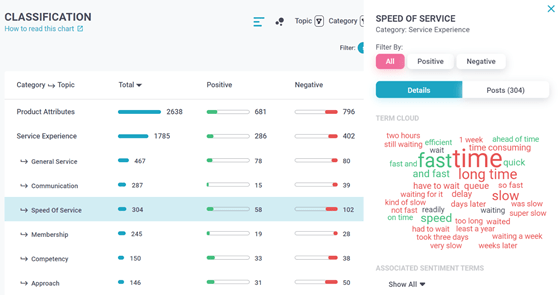
When it comes to the service experience, general service and speed are the biggest challenges. For example, there tends to be many complaints and few answers while customer service are difficult to reach.
Digital experience is the third most talked about category for Prime Video. Social media and online services are frequently mentioned.
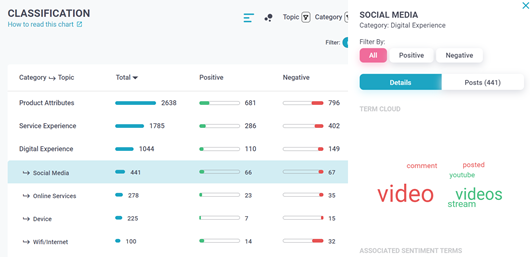
The word “video” here isn’t giving us much insight at the moment, so it’s time to delve in on a more granular level to see what the comments refer to. Here we can see that the recommendation engine isn’t up to scratch for this author.

Brand loyalty?
So now that we have discovered the most talked about topics for each brand, what can we say about brand loyalty? When it comes to the brand loyalty, some of the customers are willing to stay even if a couple of issues arise, while a number of users are willing to cancel and try out a new one as they know there are more alternatives on the market.
Psychographics
How do the psychographics of the users of the three different services compare?
The psychographics tab enables you to explore the personality traits and communications styles of your customer base. As you will discover, each of these services communicates differently and attracts a different customer segment. Ultimately, each of them requires different messaging efforts. To get this interesting chart view, click on the “streaming service” tab under psychographics.
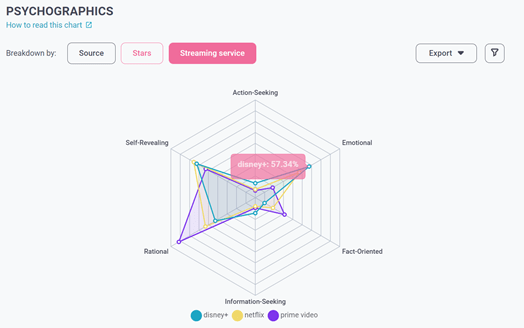
Overall
Generally we can see that most of the users are more rational than emotional. However, if we look at each of these three, Disney+ and Netflix tend to have more emotional customers, while Prime Video has significantly more rational customers.
Let’s review the messaging each of the streaming services uses and how this impacts the psychographics of their audience.
Disney+
Within their ads, Disney+ uses nostalgia by combining older and newer versions of movies. This has a big influence on parents who themselves used to watch Disney films as children prompting them to watch the classics with their own children.
Under communication styles, we can see their group of users are all but fact oriented. The reason why they are information seeking could be a result of them wanting to know about new releases. We’ve seen that users are talking a lot about cancel culture (Disney+ removed some of the politically incorrect classics) by sharing their opinions, attitudes and emotions, they are also coming across as self-revealing.
Netflix
Netflix is somewhat similar to Disney. Their users also talk about and discuss their experiences meaning that they are also self revealing. However, the three other communication styles are a lot less present. Out of these three, they’re fact-oriented at most.
Could it be due to all the conversation around price increases without adding to variety? Users are communicating about this topic emotionally, which isn’t reflected in Netflix’s advertisements – as there are none. Lack of ads is a part of their overall brand proposition. The connection they build with their customers happens through extreme personalisation of content, be it page, video, search personalisation or individual messaging. This could also explain why Netflix has an emotional connection with their users to rival Disney+.
Prime Video
As aforementioned, Prime Video has the most rational customer base. The reason for this might be because Prime Video has the lowest price point. Rational users may choose their streaming service based on which offers the most value as opposed to the overall experience. Prime Video tends to be fact-oriented and pragmatic in their communication focusing on only the necessary. This again is reflected in the lack of self-revealing customers – they do not express themselves as much. When it comes to brand equity, this brand has no direct competition amongst rational users.
Get started with the Symanto Insights Platform
As you can see, the Symanto Insights Platform is an incredible tool when it comes to discovering the unique value of each brand. It enables you to easily compare your brand with your key competitors to discover your brand’s strengths, opportunities for growth, and better understand your share of the market.
Get started with the Symanto Insights Platform. Get in touch or book your free personalised demonstration.
